Accuracy

How good the numbers are, and where they come from.

Every nutrition app implies precision. Very few say which parts of a total were looked up and which were estimated. This page is our attempt at the honest version, including the things we have not measured yet and therefore will not claim.

Every ingredient carries its origin

Emira records where each ingredient's numbers came from, and shows it on the result. These are the seven possible origins, strongest first.

  1. Barcode

    barcode

    The exact product, identified from its scanned code. The nutrition density comes from the product record.

  2. Label

    label

    Read from a nutrition table you showed Emira. As good as the label itself.

  3. Database

    database

    A catalogue entry matched by name. Correct nutrition for that product, assuming it is the product you had.

  4. You

    user

    A value you entered or corrected yourself. Emira does not overwrite it.

  5. Preference

    preference

    A product you marked as one you eat often, used to resolve an ambiguous name to the thing you actually buy.

  6. Web

    web

    A nutrition table found on a page, used when nothing in the catalogue matched confidently.

  7. Estimated

    estimated

    No authoritative source existed, so the value is a model estimate. Always labelled, and never presented as a lookup.

A meal is usually a mix of these. That is the point of showing them: a total made of scanned products behaves differently from one made of estimates, and you can tell which you are looking at.

What we have measured.

Timings are medians from our own benchmark runs. Each figure names the run it came from, so it can be checked rather than believed.

Product catalogue lookup

0.26 ms

Median over 100 German-language product queries against a 10,004-row catalogue; the 95th percentile is 0.29 ms. This is the step behind a barcode scan, which is why scanning feels instant.

benchmark/LOCAL_CATALOG_RETRIEVAL_BENCHMARK.md · measured 2026-07-12

Photo and text analysis

1.17 s

Median model latency across 19 real meal photos with an accompanying sentence. The slowest case took 3.37 s. A second, cheaper model was roughly 2.6x slower at 3.06 s median.

benchmark/vision_comparison/results/2026-07-31 · measured 2026-07-31

Recipe and web page extraction

1.40 s

Median across 8 nutrition pages, from 0.73 s to 6.04 s. This is the step that runs when you paste a recipe link and the page has to be read before anything can be logged.

benchmark/out/web_nutrition_extractor_benchmark.json · measured 2026-07-31

One accuracy figure we can stand behind

When Emira reads a nutrition table off a web page, it recovers 90.9 % of the expected values across 44 checks on 8 pages. Pattern matching on the same pages recovers 61.4 %.

This measures one step, reading a page, and nothing else. It is not Emira's overall accuracy, and we would rather say so than let a good-looking number stand in for a claim we have not tested. Source: benchmark/out/web_nutrition_extractor_benchmark.json, measured 2026-07-31.

The gap we have not closed

The question people actually want answered is: how accurate is a photo compared to a barcode compared to typing it out? We cannot answer that yet with a number. The vision benchmark runs we have compare models against each other and record latency, cost and token use, but they carry no ground truth, so there is nothing to score accuracy against.

Publishing an invented percentage on a page whose entire purpose is credibility would be self-defeating. So the honest position is the one above: here is what each method is reliably good at, here is where each one breaks, here is what we timed, and the accuracy comparison is still being measured.

What that run needs is one test set with known values sent through every input method. When it exists, the results land here, including the ones that make us look worse.
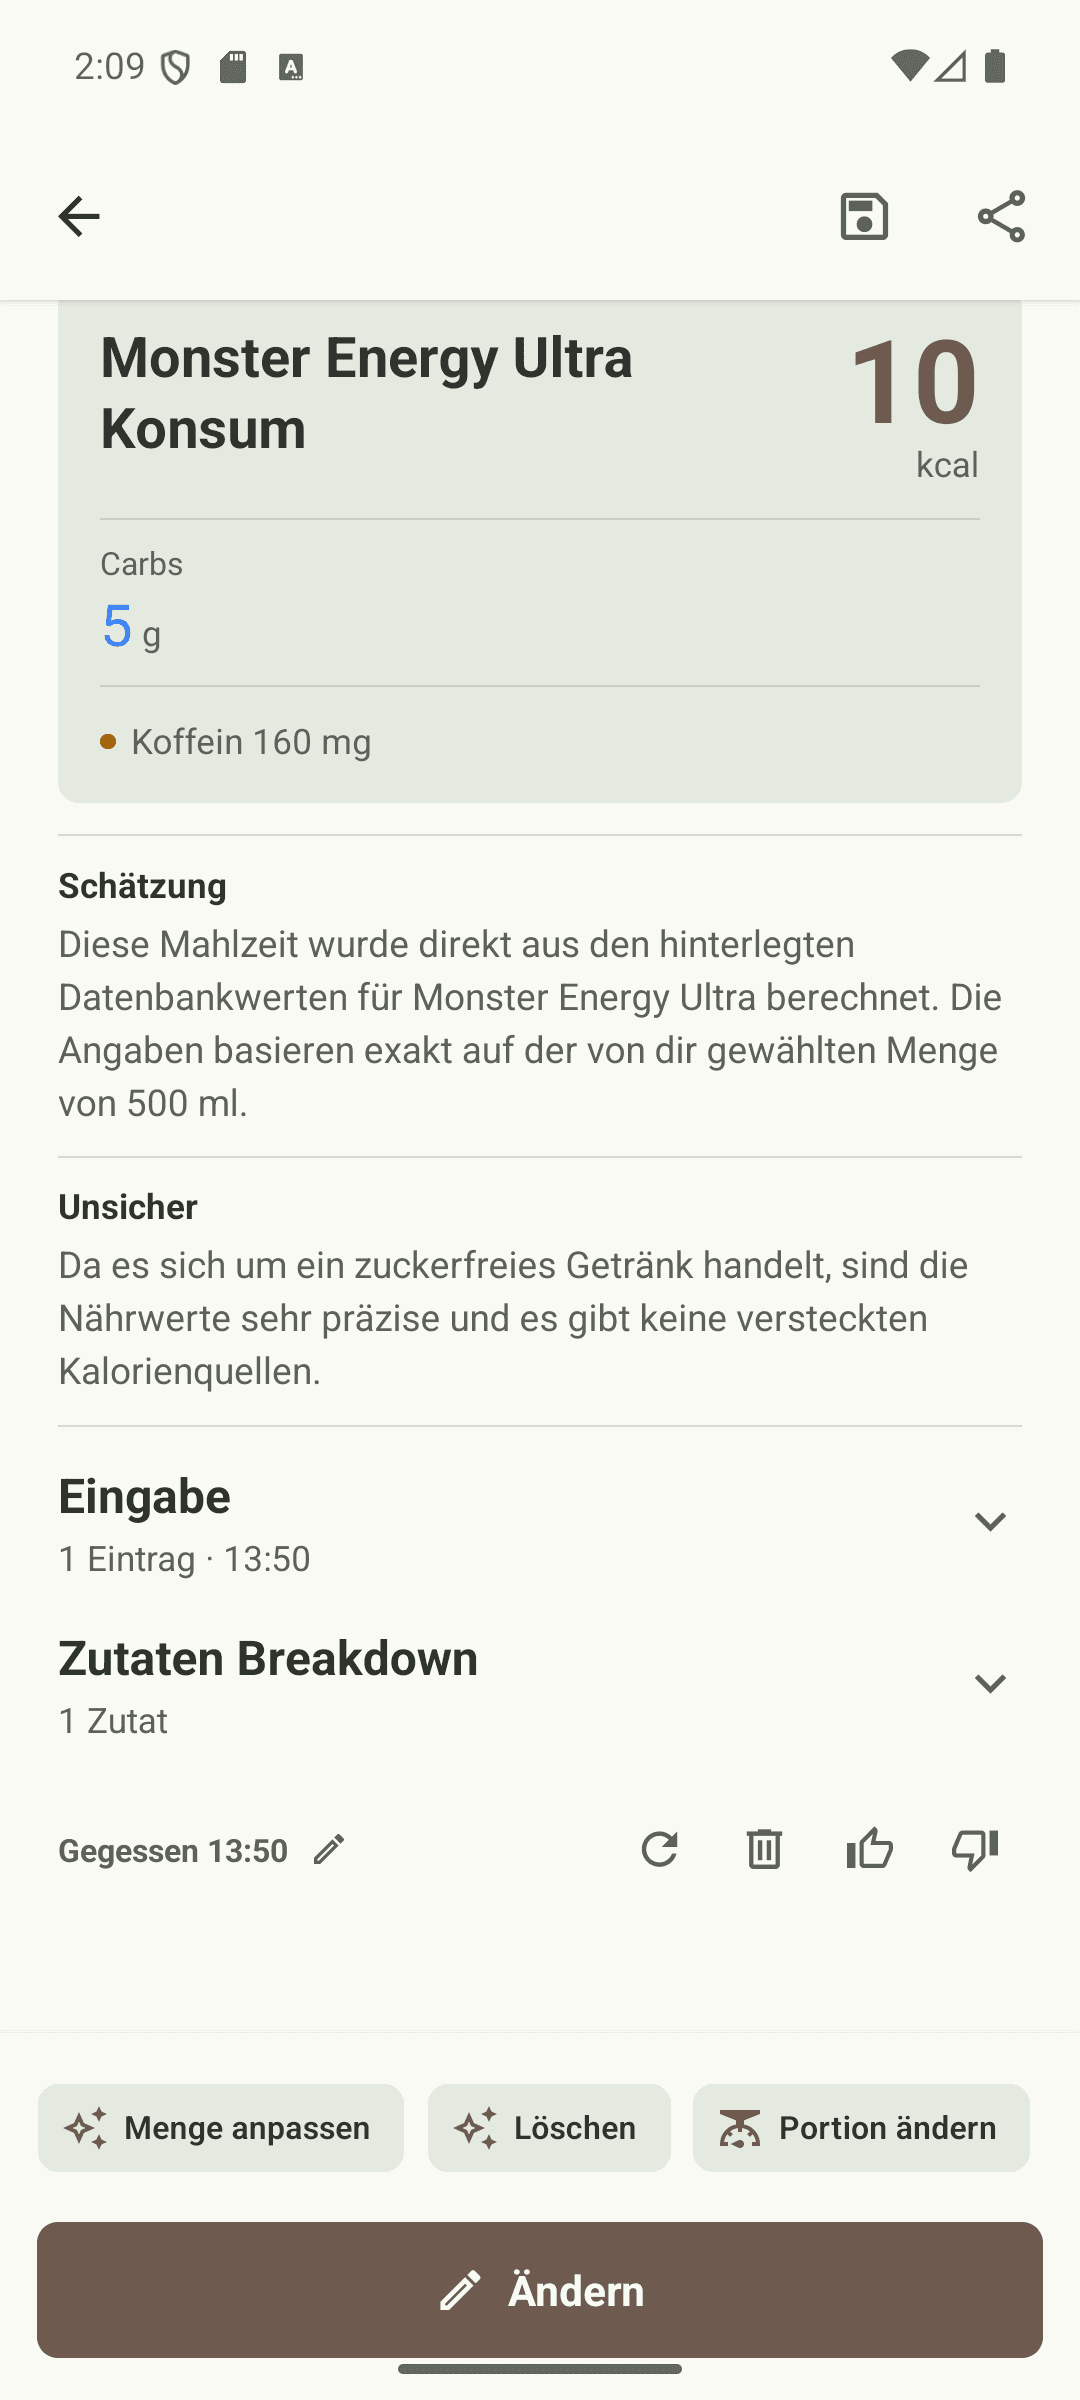
An analysed meal showing each ingredient with its source and confidence

What the wider evidence says

Under-reporting in dietary self-report is well documented and systematic rather than random: forgotten oils, sauces, drinks and unplanned additions go missing far more often than the main component of a meal. Quantity estimation, not food identification, is repeatedly the larger error source.

That is the same conclusion our own runs reached from the other direction, and it is why the app is built to log immediately and stay correctable rather than to interrogate you up front. The most accurate log is the one that still has the awkward meals in it.

Further reading with citations: why food tracking drifts and what a calorie deficit is.

Questions people ask

How accurate is Emira?
It depends almost entirely on the portion. Where the product is identified by a barcode or label and you state the amount, the numbers are as good as the product record. Where a portion is estimated from a photo, the uncertainty is real and it is shown on the ingredient rather than hidden.Compare the logging methods
Is AI making up the calorie numbers?
Not where a source exists. Values come from product records, catalogue entries and nutrition tables whenever those can be found. When nothing authoritative exists, the ingredient is marked as estimated, so you can see which parts of a total rest on a guess.See the full pipeline
What is the biggest source of error?
Portion size, consistently. Across our benchmark runs the dominant failure was never identifying the wrong food. It was how much of it there was. That matches the wider dietary assessment literature, where quantity estimation is a larger error source than food identification.Why tracking drifts, with sources
Do you publish accuracy percentages?
Only where we have measured them. We publish the web extractor's pass rate because there is a ground truth to score it against. We do not publish an accuracy figure per input method, because the runs that exist record latency and cost but no ground truth.How the app got to this point